Experiment Results
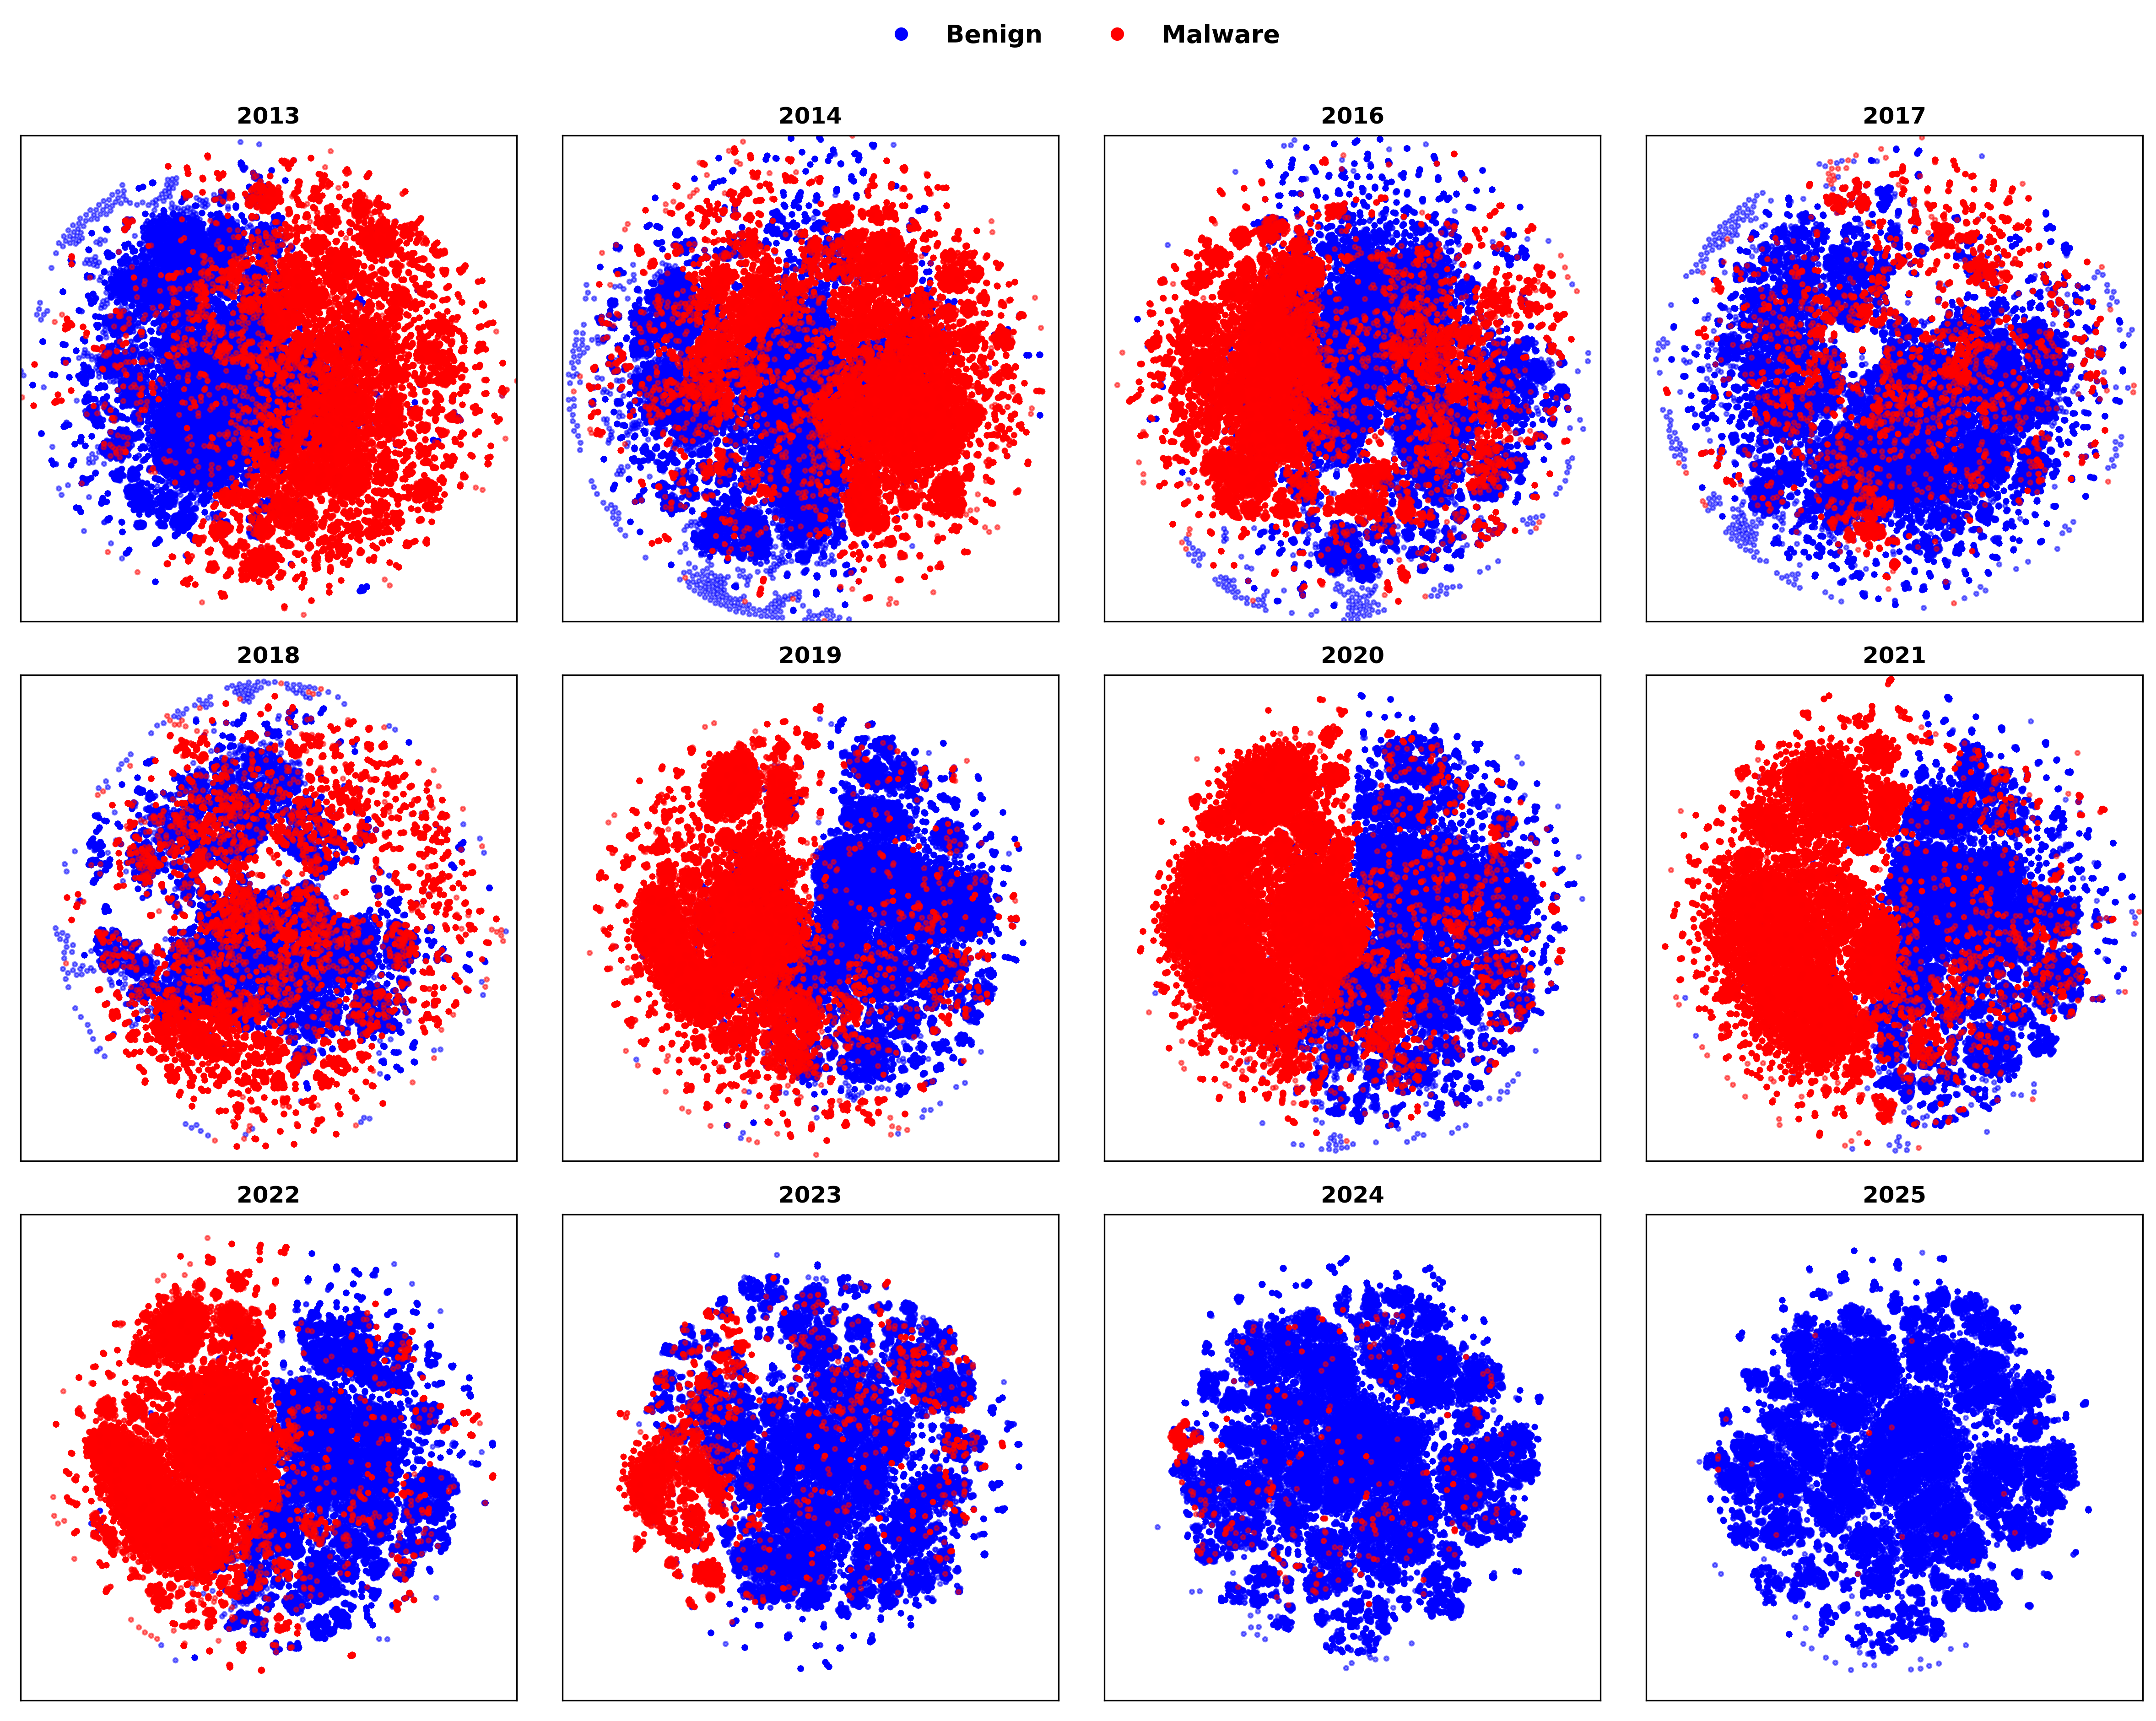
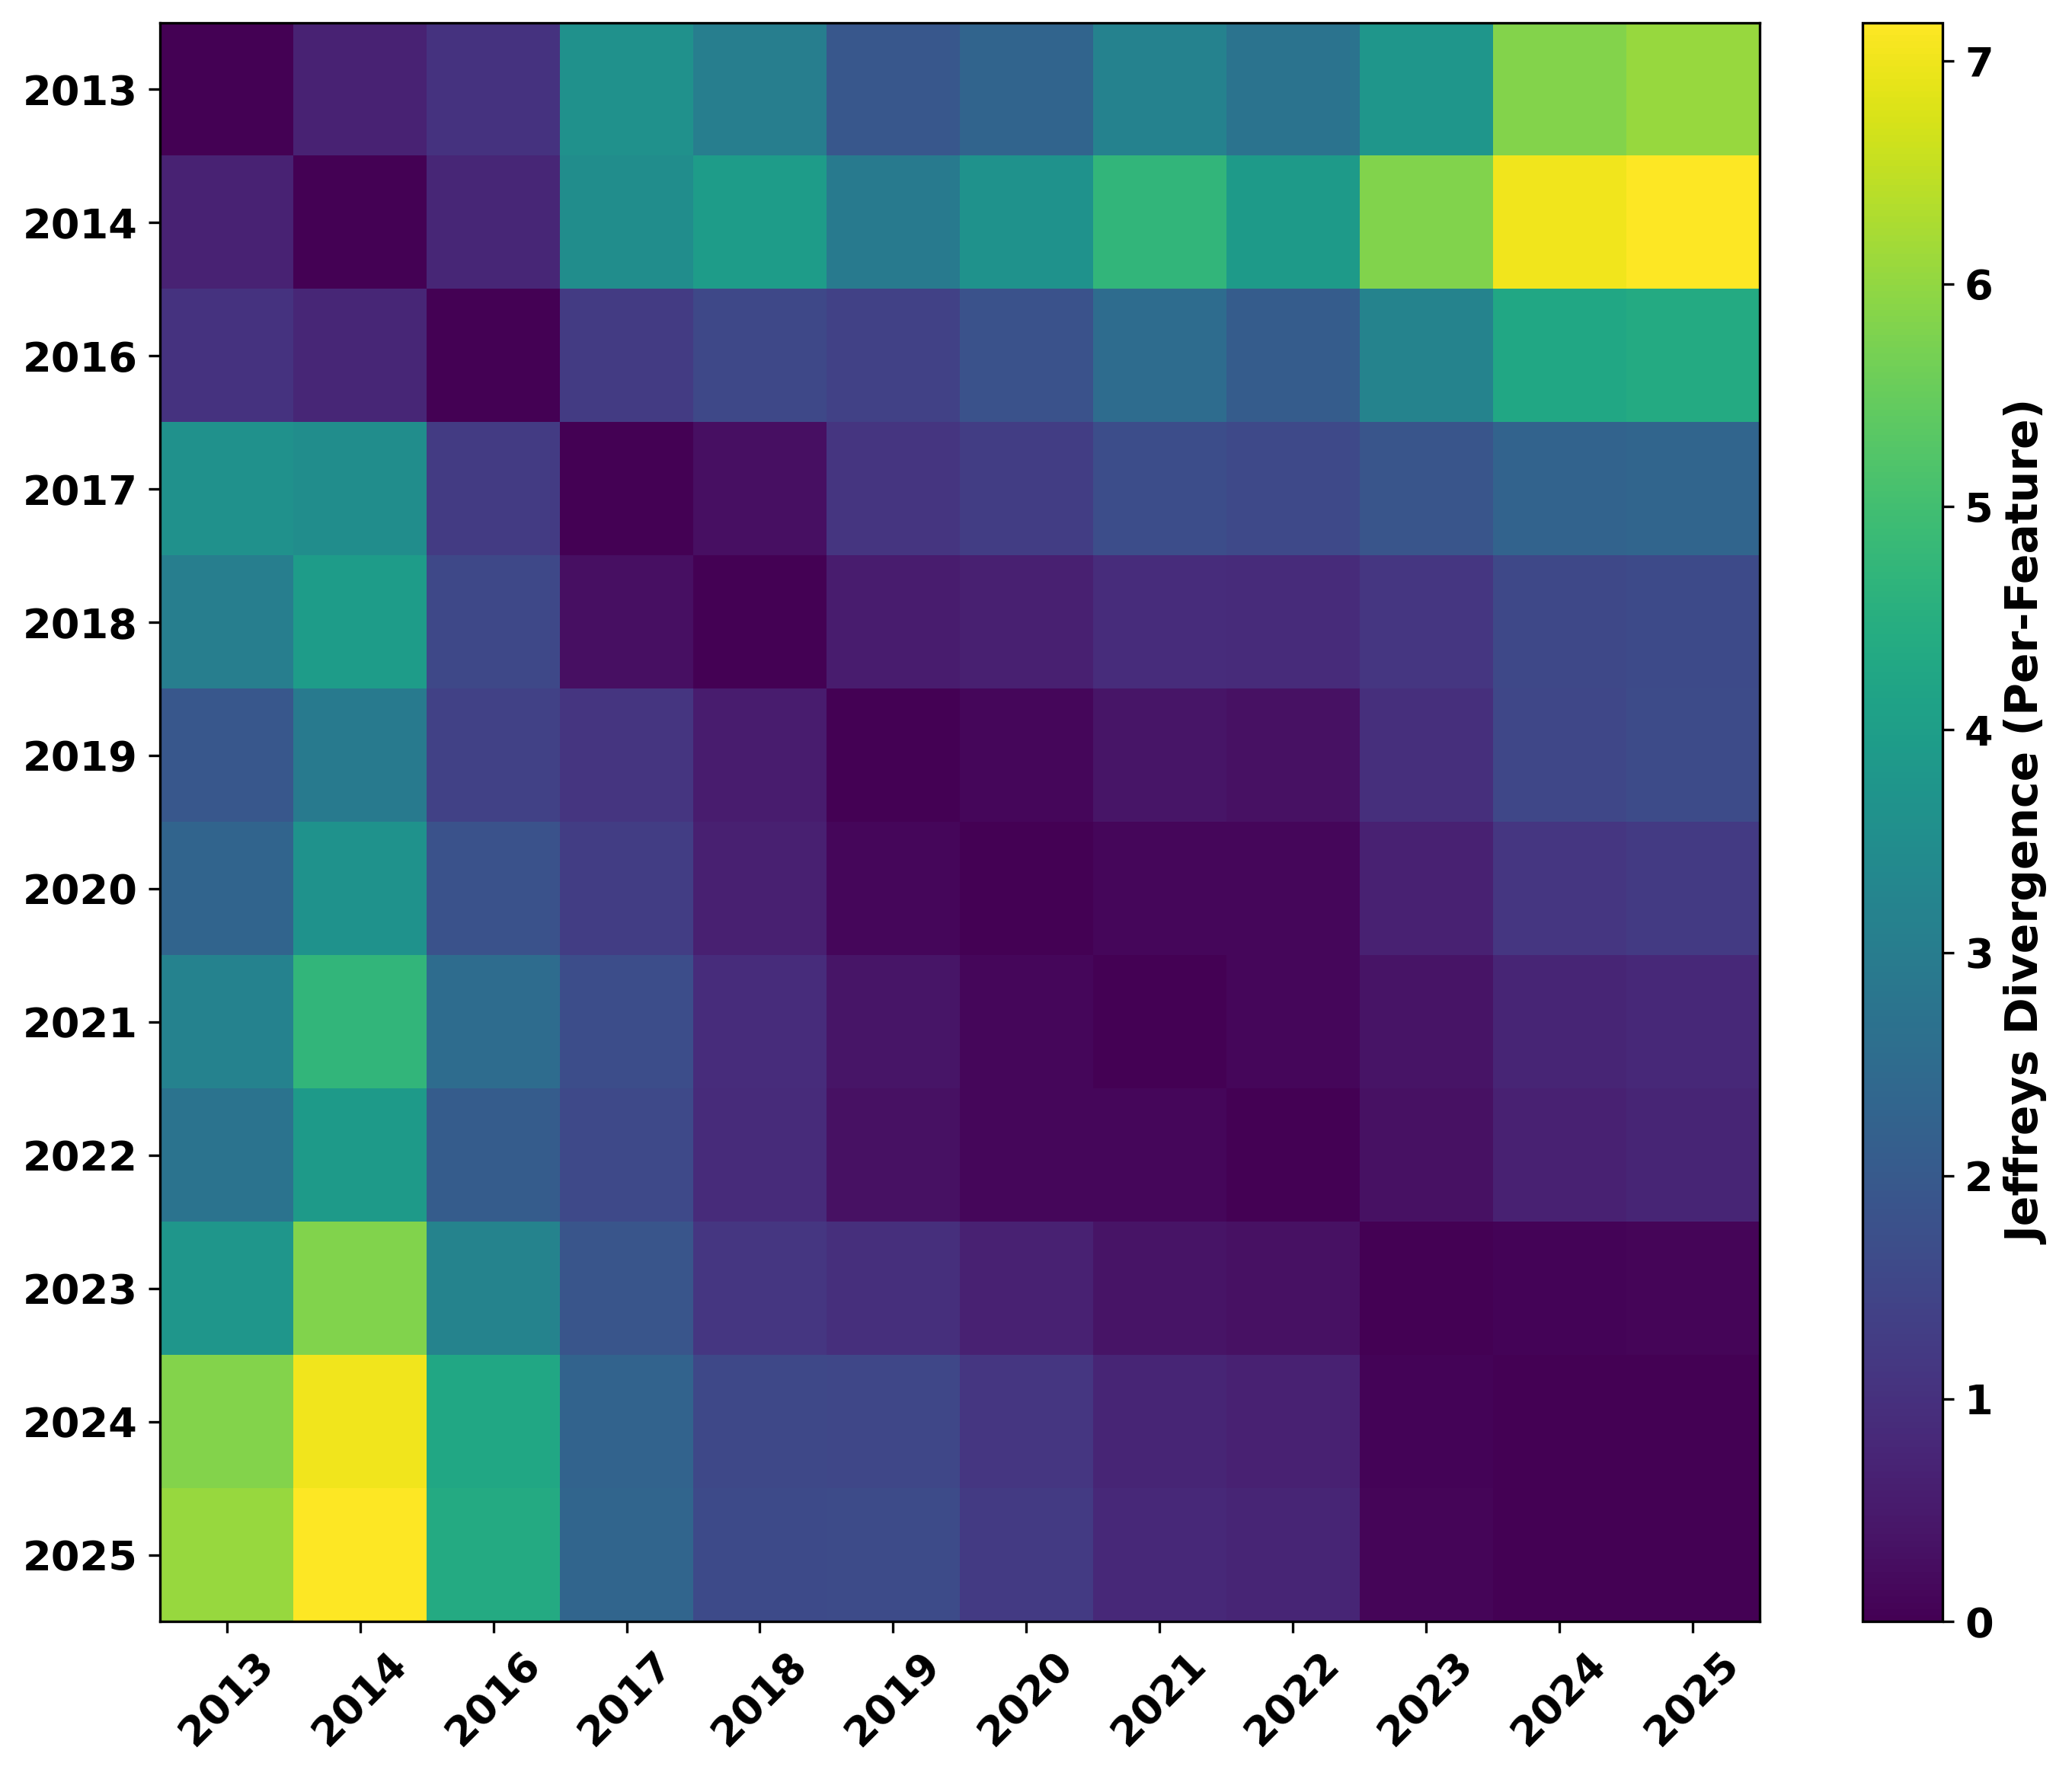
Machine learning (ML)-based malware detection systems often fail to account for the dynamic nature of real-world training and test data distributions. In practice, these distributions evolve due to frequent changes in the Android ecosystem, adversarial development of new malware families, and the continuous emergence of both benign and malicious applications. Prior studies have shown that such concept drift—distributional shifts in benign and malicious samples, leads to significant degradation in detection performance over time. Despite the practical importance of this issue, existing datasets are often outdated and limited in temporal scope, diversity of malware families, and sample scale, making them insufficient for the systematic evaluation of concept drift in malware detection.
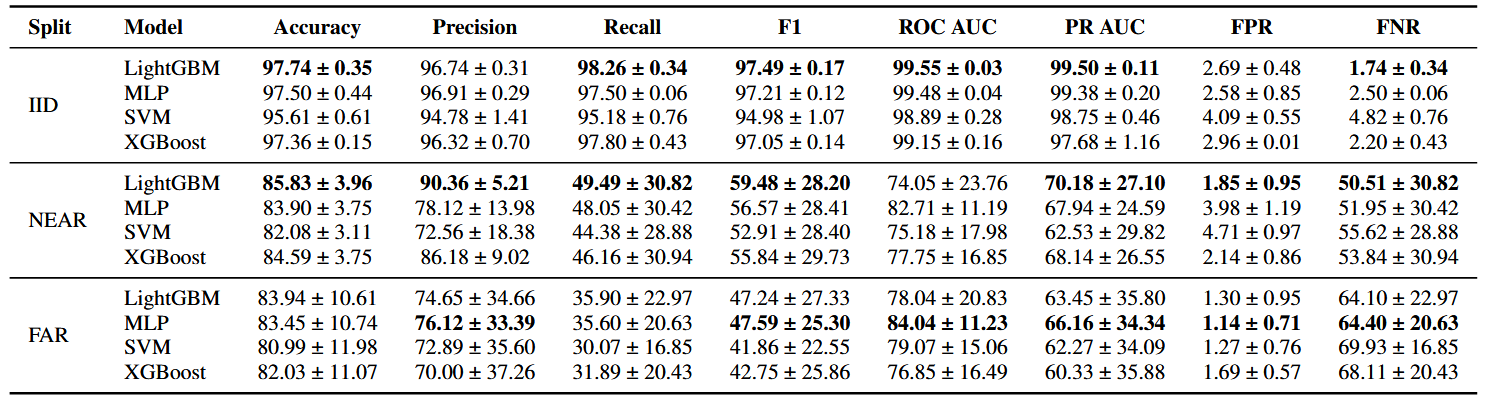
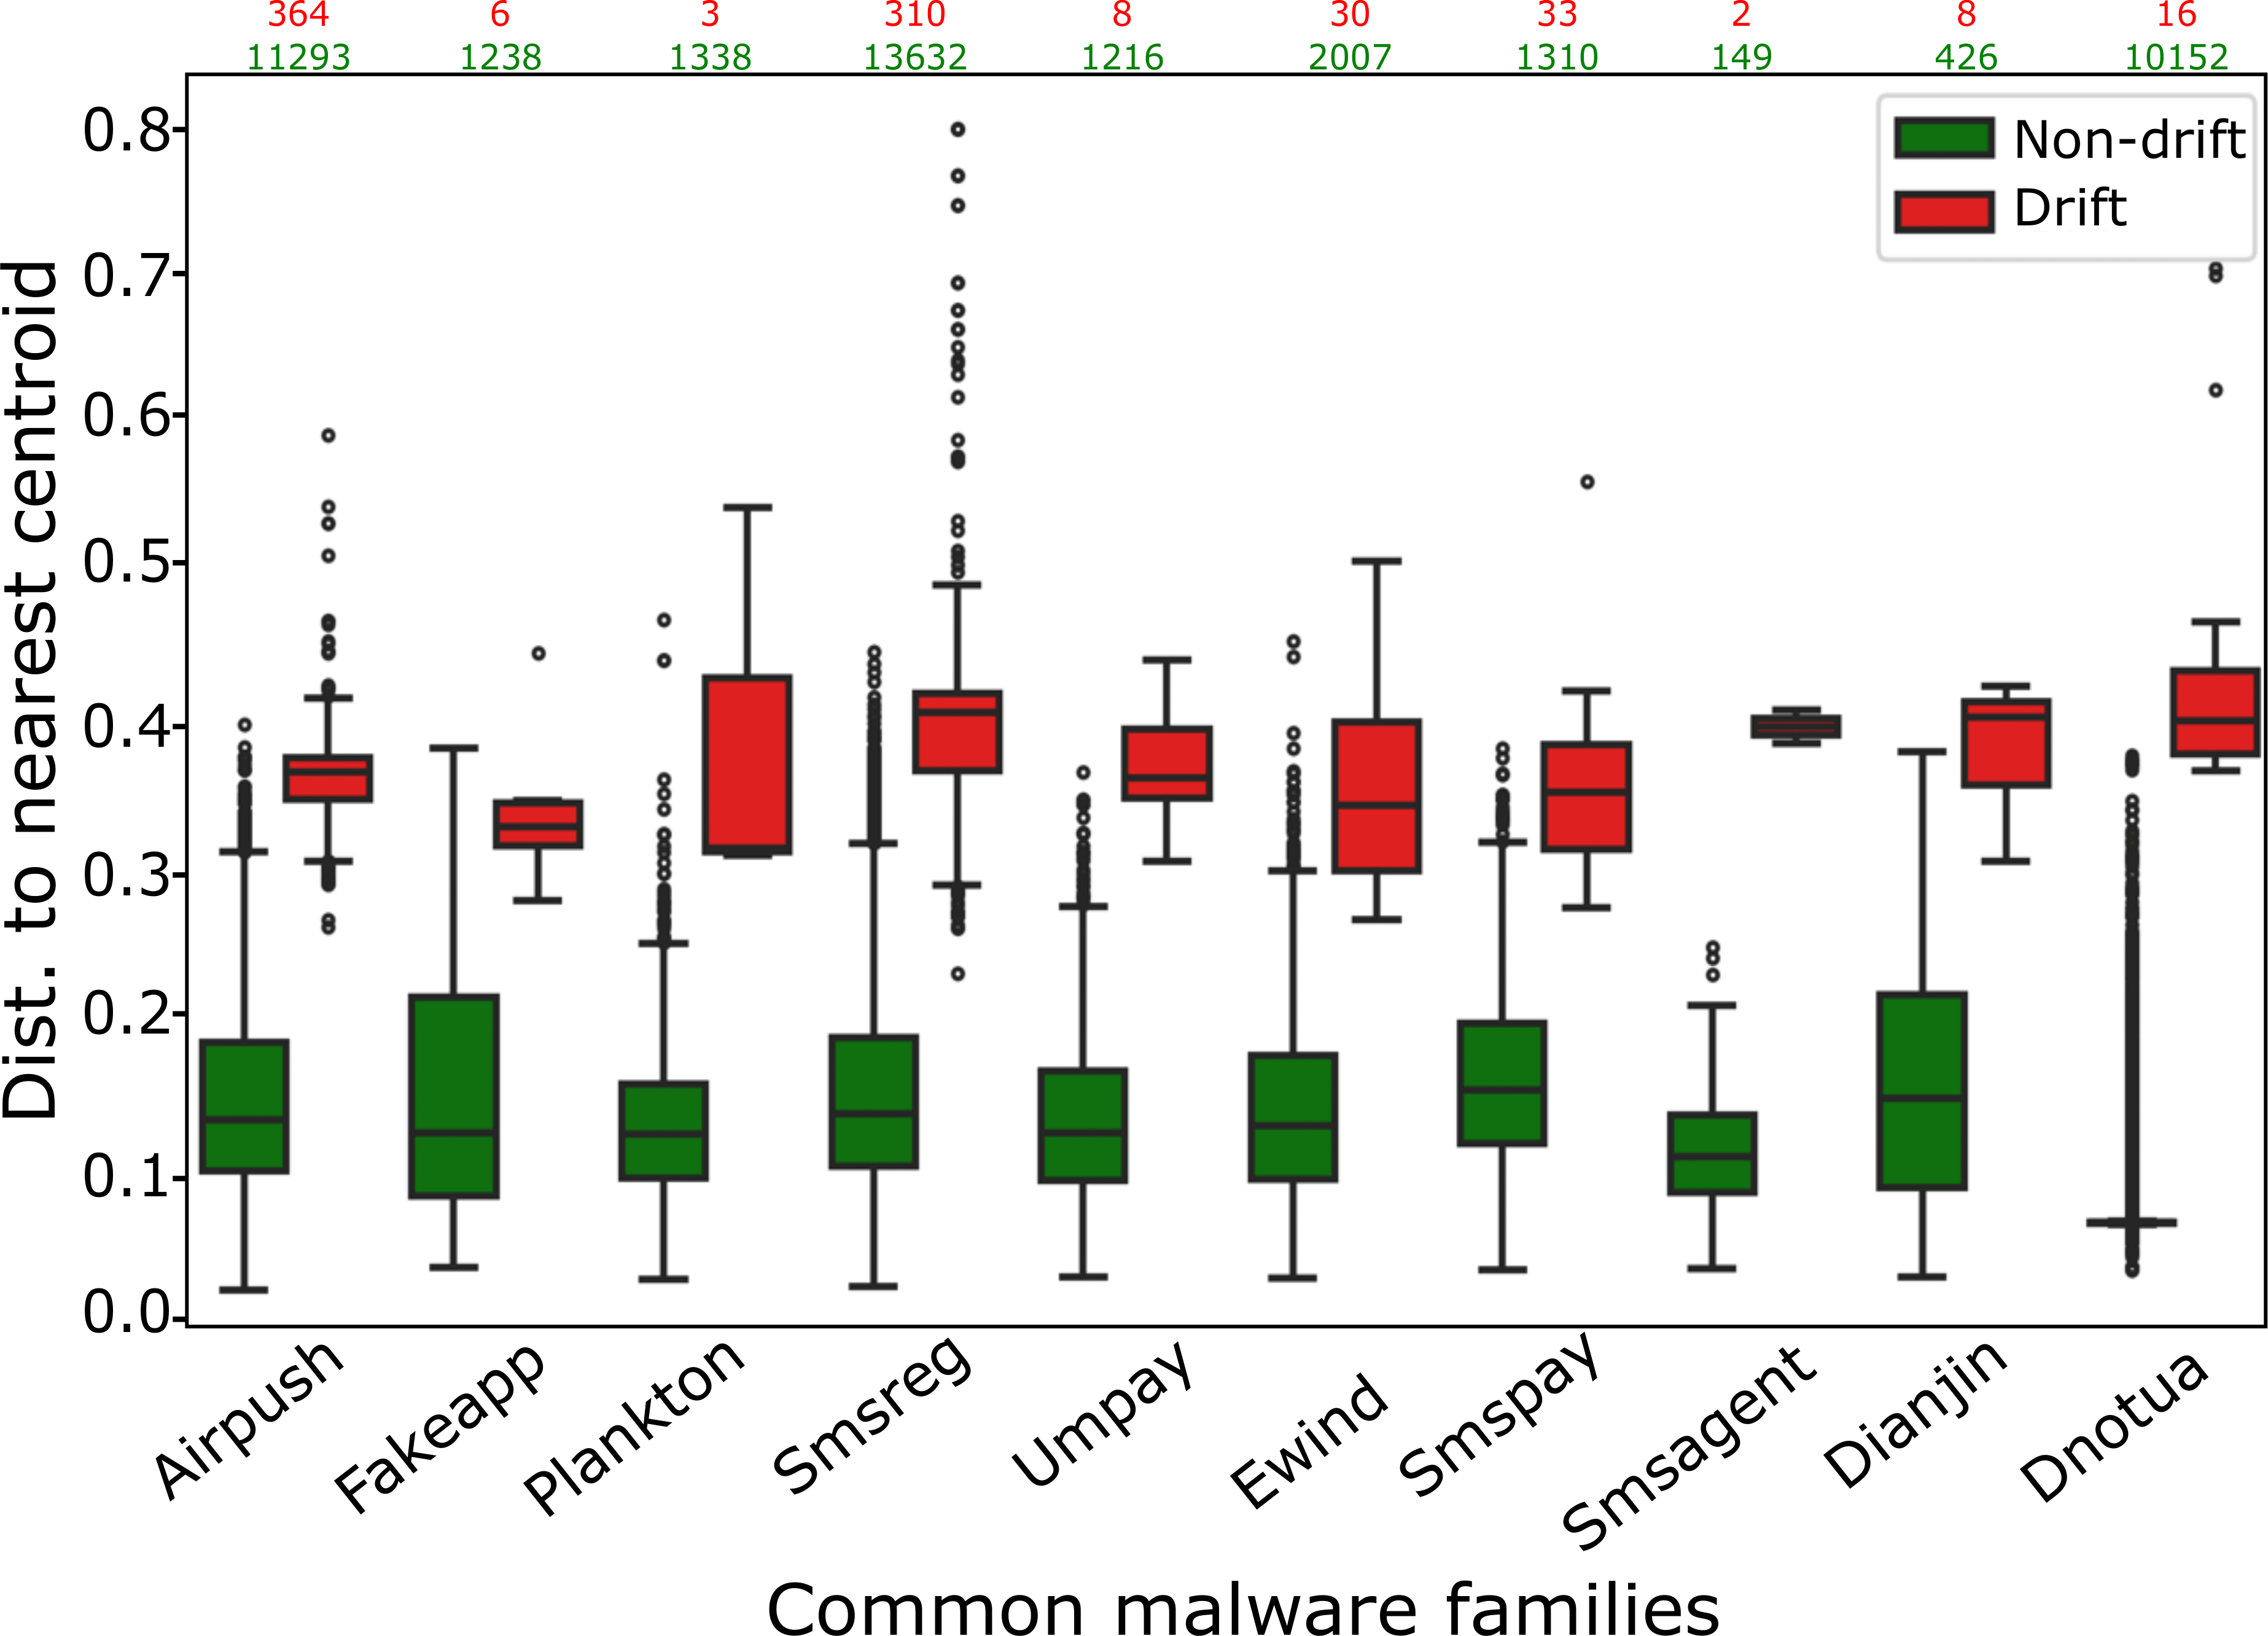
To address this gap, we present LAMDA, the largest and most temporally diverse Android malware benchmark to date, designed specifically for concept drift analysis. LAMDA spans 12 years (2013–2025, excluding 2015), includes over 1 million samples (approximately 37% labeled as malware), and covers 1,380 malware families and 150,000 singleton samples, reflecting the natural distribution and evolution of real-world Android applications. We empirically demonstrate LAMDA’s utility16 by quantifying the performance degradation of standard ML models over time and analyzing feature stability across years. As the most comprehensive Android malware dataset to date, LAMDA enables in-depth research into temporal drift, generalization, explainability, and evolving detection challenges. The dataset and code are available at https://iqsec-lab.github.io/LAMDA/.
[year]/malware/ and [year]/benign/.
apktool to extract static features:
AndroidManifest.xml: permissions, components (activities, services, receivers), hardware features, intent filterssmali code: restricted/suspicious API calls, hardcoded URLs/IPsVarianceThreshold (threshold = 0.001), resulting in 4,561 final features.
.npz (sparse matrix) and .parquet (tabular) formats. Each year’s folder includes:
X_train.parquetX_test.parquethash, label, family, vt_count, year_month, followed by binary features.
VarianceThreshold) to enable integration with ML pipelines, including Hugging Face.
| Year | Total Samples | Malware Samples | Benign Samples |
|---|---|---|---|
| 2013 | 86,431 | 44,383 | 42,048 |
| 2014 | 101,183 | 45,756 | 55,427 |
| 2016 | 109,193 | 45,134 | 64,059 |
| 2017 | 99,144 | 21,359 | 77,785 |
| 2018 | 104,292 | 39,350 | 64,942 |
| 2019 | 91,050 | 41,585 | 49,465 |
| 2020 | 102,073 | 46,355 | 55,718 |
| 2021 | 81,155 | 35,627 | 45,528 |
| 2022 | 86,416 | 41,648 | 44,768 |
| 2023 | 54,354 | 7,892 | 46,462 |
| 2024 | 48,427 | 794 | 47,633 |
| 2025 | 44,663 | 23 | 44,640 |
| Total | 1,008,381 | 369,906 | 638,475 |
| Year | New | Existing | Valid Families | # of Singletons | # of Unknown |
|---|---|---|---|---|---|
| 2013 | 213 | 0 | 213 | 1,550 | 24 |
| 2014 | 91 | 140 | 231 | 2,482 | 345 |
| 2016 | 179 | 196 | 375 | 5,861 | 177 |
| 2017 | 88 | 119 | 207 | 9,063 | 1,108 |
| 2018 | 153 | 220 | 373 | 20,579 | 1,242 |
| 2019 | 259 | 376 | 635 | 18,916 | 22 |
| 2020 | 141 | 447 | 588 | 30,644 | 25 |
| 2021 | 43 | 252 | 295 | 30,020 | 23 |
| 2022 | 161 | 490 | 651 | 24,927 | 4 |
| 2023 | 37 | 187 | 224 | 5,922 | 15 |
| 2024 | 14 | 50 | 64 | 626 | 0 |
| 2025 | 1 | 7 | 8 | 14 | 0 |
| Total | 1,380 | 150,604 | 2,985 |
Follow the steps below to install, load, explore the data in your projects.
pip install datasetspip install huggingface_hub[hf_xet] #required for XET downloading supportfrom datasets import load_dataset
dataset = load_dataset('IQSeC-Lab/LAMDA', 'Baseline')
# Check available splits
dataset.keys()# Peek a sample record
print(dataset['train'][0])Convert to pandas DataFrame:
import pandas as pd

df = pd.DataFrame(dataset['train'][:100])
print(df.head())
@inproceedings{haque2026lamda,
  title     = {LAMDA: A Longitudinal Android Malware Benchmark for Concept Drift Analysis},
  author    = {Haque, Md Ahsanul and Hossain, Ismail and Kamol, Md Mahmuduzzaman and Alam, Md Jahangir
               and Amalapuram, Suresh Kumar and Talukder, Sajedul and Rahman, Mohammad Saidur},
  booktitle = {The 14th International Conference on Learning Representations (ICLR)},
  year      = {2026},
  url       = {https://openreview.net/forum?id=1FnCrZtBNQ}
}